

Data-Driven Outcomes Reporting
As part of our commitment to research and quantifiable performance, Hillside incorporates data-driven methods into our programs and services that enable the continuous review of our performance, and the measurement of true and meaningful impact. This consistent emphasis on measurement allows our agency to create the best possible outcomes among those we serve, with the highest value to our funders and communities.
Hillside publishes annual Outcomes Reports that track the measurable performance of agency-wide programs and priorities during each fiscal year. Data from the 2025 fiscal year are featured below.
Fiscal Year 2025 – Youth, Adults & Families Served
The data below reflect outcomes for Hillside services provided from July 1, 2024 through June 30, 2025.

Gender
56% Female
43% Male
<1% Non-Binary
<1% Not Listed

Age
12% Birth-10 years
58% 11-18 years
11% 19-26 years
19% 27+ years
<1% Not Listed

Race & Ethnicity
29% Black/African-American
27% White
12% Hispanic/Latino
7% Multi-Racial
1% Asian/Pacific Islander
<1% American Indian or Alaskan Native
23% Not Listed
Youth & Families Served
Care Management for Adults**
Care Management for Children**
Day Treatment Education
Developmental Disabilities
Early Childhood Development
Foster Care
Home and Community-Based Services
Permanency Services
Preventive Services
Residential Treatment
Youth and Family Peer Support
Youth Development
Hillside provided services in partnership with 8,622 families*
*Totals are less than the sum of all service numbers because many youth, individuals, and families are enrolled in multiple programs.
**Care Management only includes clients actively enrolled.
Risk Factors
Upon admission to a Hillside program*** in FY 2025, individuals presented with the following risk factors:
- Adjustment to Trauma 78%
- School Behavior 76%
- Danger to Others 52%
- Suicide Risk 43%
- Non-Suicidal/Self-Injurious Behavior 43%
- Intentional Misbehavior 41%
- Runaway 39%
- Other Self-Harm (Recklessness) 36%
- Delinquent Behavior 29%
- Bullying 27%
- Substance Exposure 26%
- Legal 22%
- Substance Misuse 20%
- Housing Safety and Accessibility 18%
- Sexual Aggression 12%
- Fire Setting 8%
***Excludes Hillside Work-Scholarship Connection participants.
Adverse Childhood Experiences
Upon admission to a Hillside program, youth and families complete a questionnaire to identify Adverse Childhood Experiences. Frequent or prolonged ACE exposure can affect a developing brain and create significant long-term health impacts, but early intervention can reduce those risks.
Among individuals entering Hillside programs*** in FY 2025, the most frequently indicated ACEs included:
- Disruption in Caregiving/Attachment Losses 74%
- Emotional Abuse 56%
- Family Violence 55%
- Neglect 54%
- Physical Abuse 41%
- Sexual Abuse 36%
- Community/School Violence 24%
- Criminal Activity 23%
- Victimization/Exploitation 12%
- Medical Trauma 10%
- Natural or Manmade Disaster 8%
***Excludes Hillside Work-Scholarship Connection participants.
Fiscal Year 2025 – Outcomes at Discharge
Through input gathered on an ongoing basis from those we serve, Hillside can determine critical measures that illustrate the impact of our integrated programs in the lives of youth, adults and families.
Positive Results
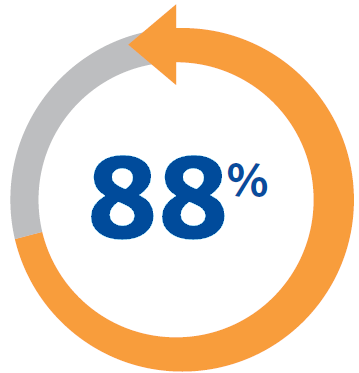
Based on surveys conducted with families served by Hillside in FY 2025:
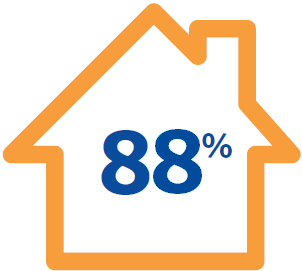
of those served were in a permanent living situation (living with their biological or adoptive families, or independently)
of youth discharged from residential programs transitioned to less intensive services
of youth discharged from community-based programs avoided higher intensity services
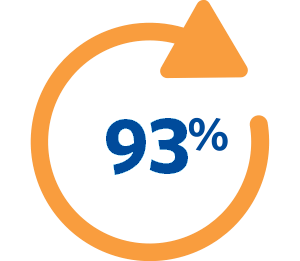
Family Satisfaction
Based on surveys conducted with families served by Hillside in FY 2025:
of families were highly satisfied with services received and highly likely to recommend Hillside programs to family members or friends
Spotlight on Program-Specific Outcomes
Select Hillside programs feature common traits that support the use of specific assessment tools that enable a more thorough understanding of the programs’ effectiveness.
Strengthening Connections & Support
Hillside uses the Youth Connections Scale in Permanency and Family Finding services to measure relational permanency and supports that are critical to a young person’s long-term success.
of youth discharged in FY 2025 increased their connections and supports between admission and discharge
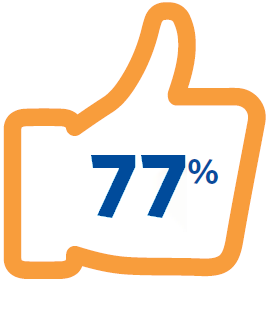
Supporting Whole Family Interventions
In Hillside programs that incorporate Family Peer Support, the Family Assessment of Needs and Strengths (FANS) measures family functioning, to support effective interventions for entire families rather than single individuals.
of families assessed in FY 2025 reported improved needs and strengths
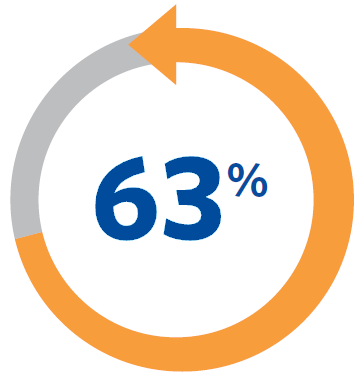
Assessing Family Functioning
Upon admission and discharge from applicable Hillside programs, families complete the North Carolina Family Assessment Scale (NCFAS) to measure improvements in family functioning that occurred during the time services were received. NCFAS domains include Environment, Parental Capabilities, Family Interactions, Family Safety, Child Well-Being, Social/Community Life, Self-Sufficiency, Family Health, Caregiver/Child Ambivalence and Readiness for Reunification.

of families reported improved family functioning during FY 2025
Download Outcomes Reports
Click on any image to view or download complete past years’ Outcomes Reports for Hillside programs and Hillside Work-Scholarship Connection.
Hillside
Outcomes Reports
Hillside Work-Scholarship Connection
Outcomes Reports